

Listen to this article
Audio version — Practical Guide to Installing and Operating an AODD PumpAt Antlia, we offer a variety of AODD pumps across our range. In this guide, we focus on the AOD 40 model as a worked example — but the method for reading a performance curve applies to all AODD pump models. Understanding how to read a performance curve allows you to select the right pump and correctly size your compressed air supply for any application.
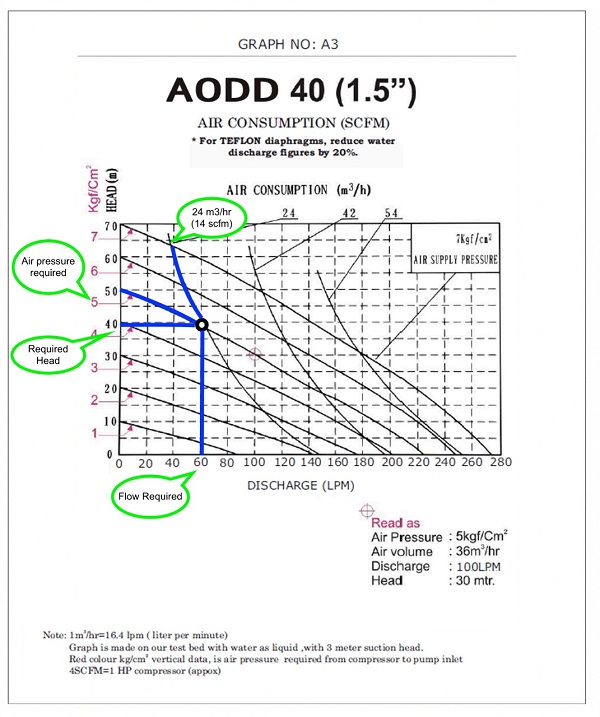
The performance curve for the AOD 40 model shows the required inlet air pressure to pump a specific volume of liquid at a specific discharge pressure. The pump is capable of the following:
The performance curve may look complicated at first glance — but with a little explanation, it is straightforward to use. Let's break down each component of the graph.
The bottom horizontal axis shows the discharge of liquid in litres per minute (LPM). This is the flow rate output of the pump at any given operating condition.
The left vertical axis shows the air pressure in bar — measured from 0 to 7 bar. This is the inlet air pressure required to achieve a given flow rate at a given discharge pressure.
The black point is the air consumption reference point — it shows the pump's air consumption in both m³/hr and SCFM (Standard Cubic Feet per Minute) at any operating condition.
Let's work through a practical example: We need 60 litres per minute at 4 bar discharge pressure. What inlet air pressure and air consumption (SCFM) do we need?
Find 4 bar on the Y-axis. Place your pointer on the 4 bar line on the left-hand (red) Y-axis. This is your required discharge pressure.
Find 60 LPM on the X-axis. Locate 60 litres per minute on the bottom horizontal X-axis. This is your required flow rate.
Find the intersection point. Draw a vertical line upward from 60 LPM and a horizontal line across from 4 bar. Find where these two lines meet on the nearest solid blue curve on the graph.
Read the inlet air pressure. Follow the closest solid blue line up to the left until it meets the Y-axis. This is the inlet air pressure required. In this case: 5 bar inlet pressure.
Read the air consumption. Trace the pointer along the nearest blue line from the intersection point to the connected green box (via the black reference point). This gives the required air consumption. In this case: 14 SCFM.
The performance curve allows you to calculate the air consumption and pressure required to move a specific volume of liquid at a specific discharge pressure — for every operating point the pump can run at.
This is critical for:
Share your required flow rate (LPM) and discharge pressure (bar) with our engineers — we will match you to the right AOD pump model from our range and provide the performance curve.
Get Free Pump Selection Help Call +91 9819395995The X-axis (bottom horizontal axis) shows the discharge of liquid or fluid in litres per minute (LPM) — the flow rate output of the pump at any given operating condition.
The Y-axis (vertical axis, shown in red) shows the air pressure in bar — measured from 0 to 7 bar. It represents the inlet air pressure required to achieve a specific flow rate at a specific discharge pressure.
The black point is a reference point that shows the air consumption of the pump — measured in both cubic metres per hour (m³/hr) and standard cubic feet per minute (SCFM). It is used to determine how much compressed air the pump consumes at any given operating condition.
Identify your required flow rate on the X-axis and your required discharge pressure on the Y-axis. Find the intersection on the nearest blue curve, then follow the curve to the Y-axis to read the required inlet air pressure. Trace to the black point to read the air consumption in SCFM.